In a world where everyone talks about being “data-driven,” most teams are still drowning in spreadsheets and wasting time building last month’s report. What if you could get a crystal-clear view of your project and sales KPIs—not tomorrow, but right now, on a dashboard that’s 100% yours?
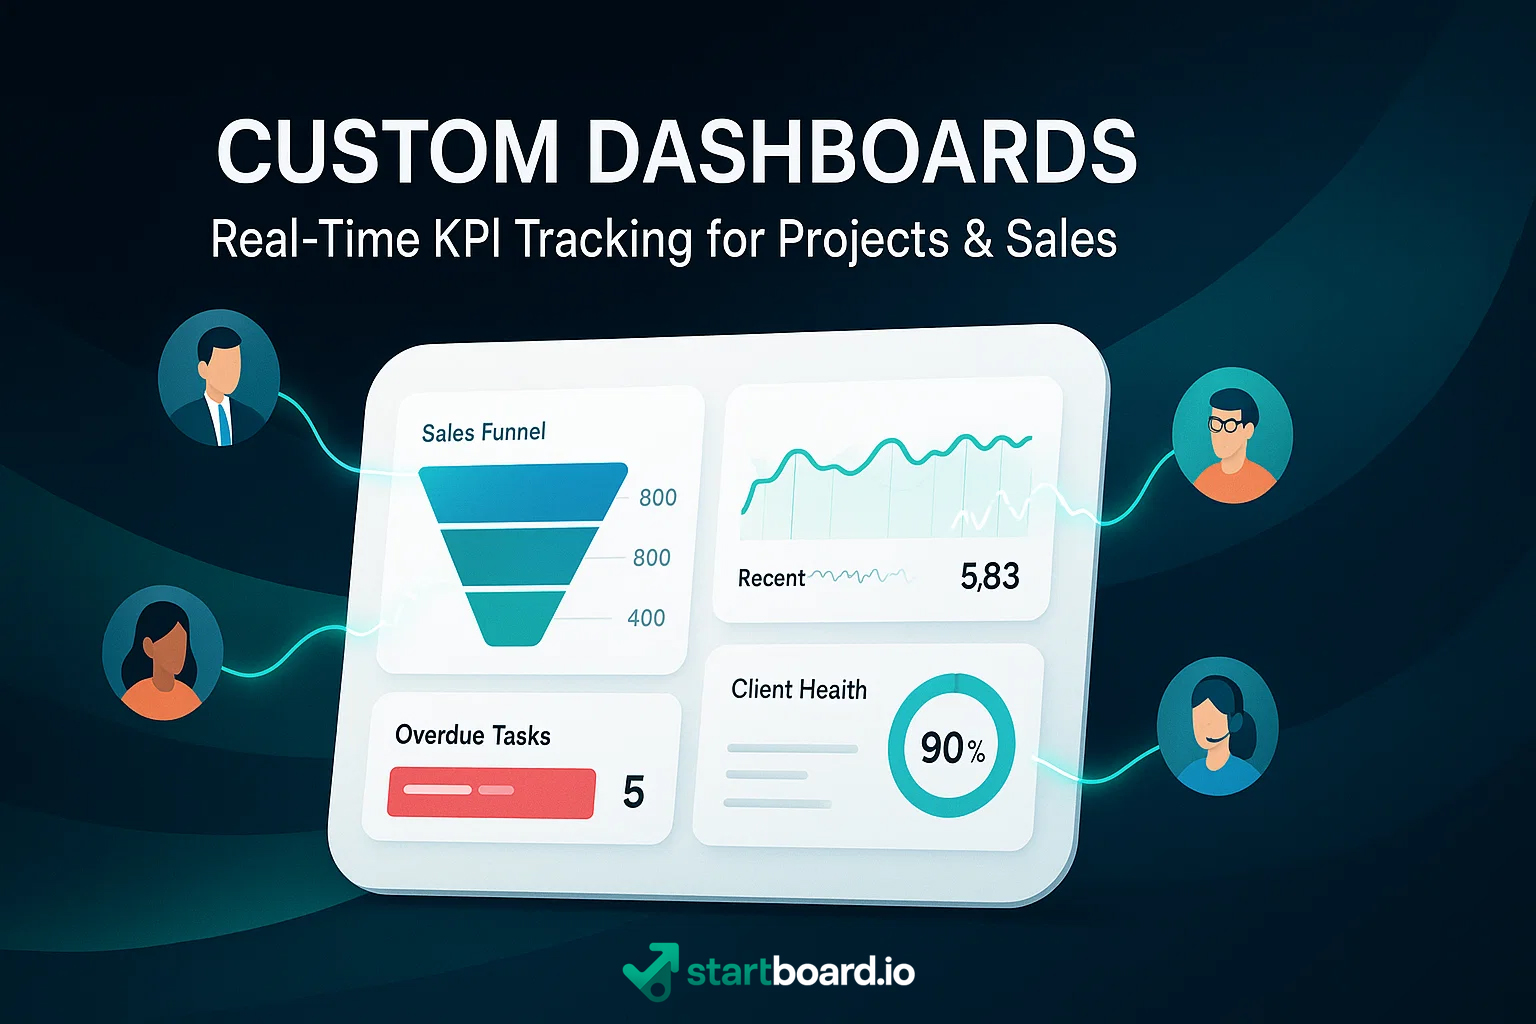
That’s the promise of custom dashboards: real-time insights, at a glance, tailored to what really moves the needle for your business. Forget one-size-fits-all templates. Imagine live pipeline charts, instant sales metrics, project health cards, and smart alerts—all in a workspace that fits your team like a glove.
In this guide, we’ll show you how to build, customize, and leverage dashboards that don’t just look good—they make you faster, smarter, and ready for anything. Whether you’re a sales leader, project manager, or founder, it’s time to move from manual tracking to confident, always-on decision-making.
Ready to take control of your data? Let’s get started.
What Is a Custom Dashboard?
A custom dashboard is your mission control for business performance. Instead of bouncing between dozens of spreadsheets and static reports, you get all your most important project and sales metrics—pipeline overview, project deadlines, revenue, lead velocity, client health—in one unified, configurable interface.
With StartBoard, every user in your team can build their own dashboard. Pick the widgets you care about: a live sales funnel, a project progress bar, revenue visualizations, or custom client health indicators. Set up personalized alerts, choose your favorite chart types, and organize everything just the way you want.
This isn’t just about pretty visuals (though you’ll love the look). True value comes from data aggregation—pulling info from all your tools and turning it into actionable, unified reporting. Your dashboard is more than a display: it’s a real-time workspace where visualization meets decision-making.
Forget static templates. With StartBoard, your dashboard is as unique as your workflow—and it updates itself, so you’re always a step ahead.
Key Benefits of Custom Dashboards
Custom dashboards are more than just a pretty interface—they’re the engine room for smarter, faster teamwork.
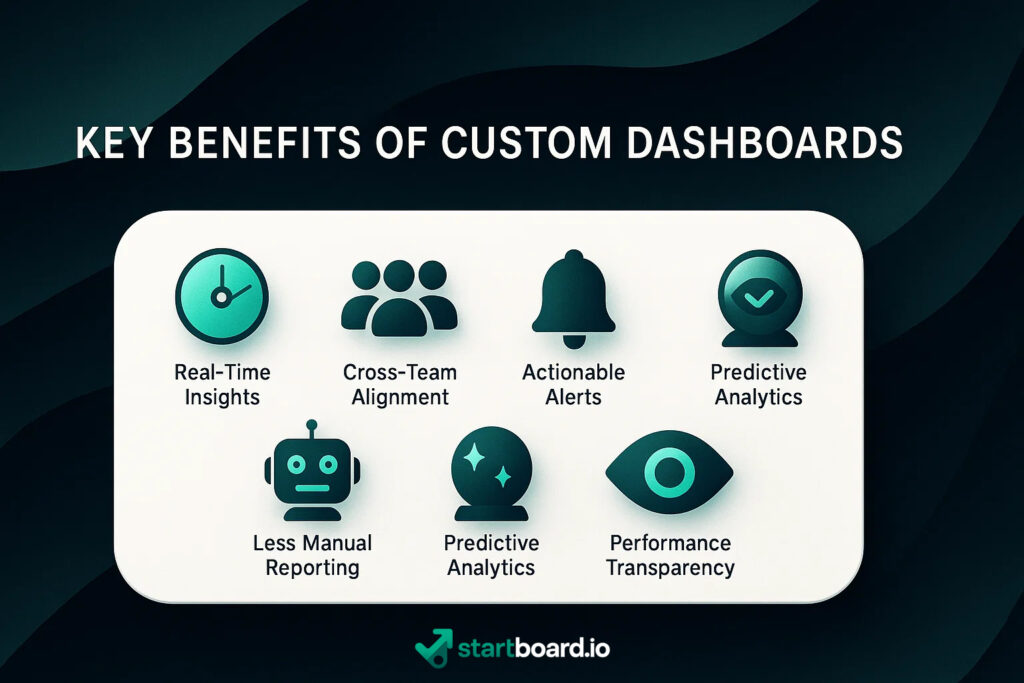
Here’s what you unlock:
Real-time insights
Get live data on every KPI that matters. No more waiting for end-of-week exports or scrambling for updates; you always know exactly where things stand.
Cross-team alignment
Sales, project, and leadership teams see the same story. With unified data, it’s easy to get everyone moving in the same direction.
Actionable alerts
Set up intelligent alerting so you never miss a deadline, a pipeline dip, or a red flag. Get notified instantly, not after the damage is done.
Less manual reporting
Ditch the copy-paste routine. Custom dashboards automate your most tedious reports, freeing up your time for real strategy and action.
Improved forecasting with predictive analytics
Go beyond “what happened” and start seeing “what’s likely to happen.” Predictive analytics give you the edge in planning and resource allocation.
Performance transparency
Everyone from leadership to the front line sees the numbers that drive your business, boosting accountability and trust.
Faster decision-making, smarter workflow automation
Act on data in real time, automate follow-ups, and streamline your workflows—so nothing falls through the cracks.In fact, not being able to rely on spoken word made them better storytellers. They fully understood and used the power of showing without words.
Essential KPIs to Track
When it comes to dashboards, one size never fits all. The beauty of a custom setup is that everyone can define their own dashboard and key performance indicators (KPIs) based on their unique role and priorities.
If you manage a team, you’ll want to keep a close eye on overdue tasks, individual workloads, and project milestones—so you can spot bottlenecks, balance the load, and keep things moving.
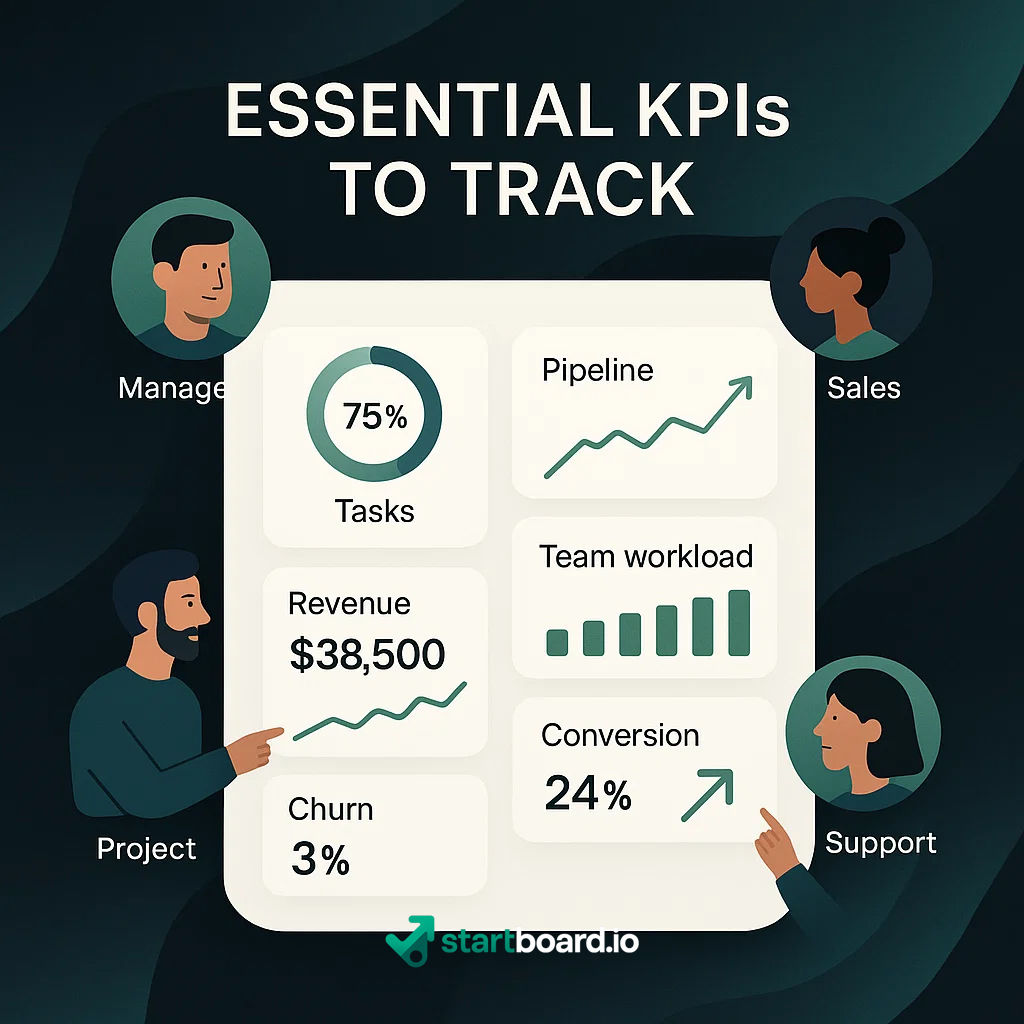
If you’re in sales, your dashboard will highlight new leads, conversion rates, pipeline value, win rates, and recurring revenue (MRR/ARR). Want to dive deeper? Track advanced metrics like lead velocity, pipeline health, churn rate, and customer acquisition cost (CAC) to drive smarter growth.
Project leads might monitor tasks completed, upcoming deadlines, and team velocity, while customer success roles focus on retention, upsells, and client health indicators.
Whatever your job, the real magic is that you choose the KPIs that move the needle for you—no noise, just signal. With StartBoard, each member builds the dashboard that matches their role, responsibilities, and goals. It’s real-time, relevant, and as dynamic as your day-to-day.
Dashboard Examples by Role
1. Team Manager / Operations Lead
- KPIs : Tasks overdue (by user), milestones status, average completion time, team workload, process bottlenecks, alerting on deadline risks.
- Widgets : Gantt chart, workload heatmap, late tasks list, milestone tracker, notifications.
2. Sales Rep / Sales Manager
- KPIs : New leads, pipeline value, win rate, conversion rate, average deal size, MRR/ARR, lead velocity, pipeline health, forecasted revenue.
- Widgets : Funnel visualization, leaderboard, forecast chart, deals by stage, revenue over time.
3. Project Manager
- KPIs : Tasks completed, progress by milestone, overdue actions, resource allocation, blockers, burn down/up charts.
- Widgets : Kanban board, project timeline, progress ring, overdue alerts.
4. Customer Success / Support
- KPIs : Client health score, renewal rate, churn rate, NPS, tickets closed, upsell opportunities.
- Widgets : Client dashboard, churn risk alert, satisfaction trend, support volume by client.
5. C-Level / Founder
Widgets : Executive summary, company scorecard, metric comparison, key trend highlights.
KPIs : MRR/ARR, net new customers, CAC, churn, pipeline health, cashflow forecast, high-level project status.